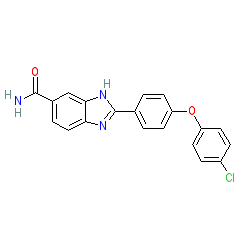
GtoPdb is requesting financial support from commercial users. Please see our sustainability page for more information.
|
Compound class:
Synthetic organic
Ligand Activity Visualisation ChartsThese are box plot that provide a unique visualisation, summarising all the activity data for a ligand taken from ChEMBL and GtoPdb across multiple targets and species. Click on a plot to see the median, interquartile range, low and high data points. A value of zero indicates that no data are available. A separate chart is created for each target, and where possible the algorithm tries to merge ChEMBL and GtoPdb targets by matching them on name and UniProt accession, for each available species. However, please note that inconsistency in naming of targets may lead to data for the same target being reported across multiple charts. ✖ |
|
|||||||||||||||||||||||||||||||||||
| References |
|
1. Anastassiadis T, Deacon SW, Devarajan K, Ma H, Peterson JR. (2011)
Comprehensive assay of kinase catalytic activity reveals features of kinase inhibitor selectivity. Nat Biotechnol, 29 (11): 1039-45. [PMID:22037377] |
|
2. Fedorov O, Marsden B, Pogacic V, Rellos P, Müller S, Bullock AN, Schwaller J, Sundström M, Knapp S. (2007)
A systematic interaction map of validated kinase inhibitors with Ser/Thr kinases. Proc Natl Acad Sci USA, 104 (51): 20523-8. [PMID:18077363] |
|
3. Gao Y, Davies SP, Augustin M, Woodward A, Patel UA, Kovelman R, Harvey KJ. (2013)
A broad activity screen in support of a chemogenomic map for kinase signalling research and drug discovery. Biochem J, 451 (2): 313-28. [PMID:23398362] |


