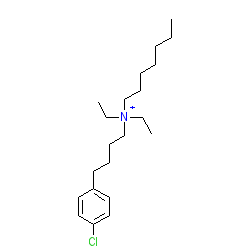
GtoPdb is requesting financial support from commercial users. Please see our sustainability page for more information.
|
Compound class:
Synthetic organic
Ligand Activity Visualisation ChartsThese are box plot that provide a unique visualisation, summarising all the activity data for a ligand taken from ChEMBL and GtoPdb across multiple targets and species. Click on a plot to see the median, interquartile range, low and high data points. A value of zero indicates that no data are available. A separate chart is created for each target, and where possible the algorithm tries to merge ChEMBL and GtoPdb targets by matching them on name and UniProt accession, for each available species. However, please note that inconsistency in naming of targets may lead to data for the same target being reported across multiple charts. ✖ |
|
|||||||||||||||||||||||||||||||||||
| References |
|
1. de Los Angeles Tejada M, Stolpe K, Meinild AK, Klaerke DA. (2012)
Clofilium inhibits Slick and Slack potassium channels. Biologics, 6: 465-70. [PMID:23271893] |
|
2. Gessner G, Heinemann SH. (2003)
Inhibition of hEAG1 and hERG1 potassium channels by clofilium and its tertiary analogue LY97241. Br J Pharmacol, 138 (1): 161-71. [PMID:12522086] |
|
3. Malayev AA, Nelson DJ, Philipson LH. (1995)
Mechanism of clofilium block of the human Kv1.5 delayed rectifier potassium channel. Mol Pharmacol, 47 (1): 198-205. [PMID:7838129] |
|
4. Niemeyer MI, Cid LP, Barros LF, Sepúlveda FV. (2001)
Modulation of the two-pore domain acid-sensitive K+ channel TASK-2 (KCNK5) by changes in cell volume. J Biol Chem, 276 (46): 43166-74. [PMID:11560934] |


