GtoPdb is requesting financial support from commercial users. Please see our sustainability page for more information.
|
Compound class:
Natural product
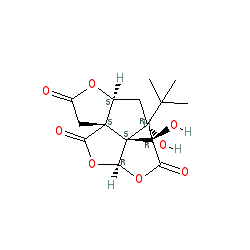
Comment: Bilobalide is one of the terpenoid compounds found in the leaves of the Ginkgo biloba tree.
Ligand Activity Visualisation ChartsThese are box plot that provide a unique visualisation, summarising all the activity data for a ligand taken from ChEMBL and GtoPdb across multiple targets and species. Click on a plot to see the median, interquartile range, low and high data points. A value of zero indicates that no data are available. A separate chart is created for each target, and where possible the algorithm tries to merge ChEMBL and GtoPdb targets by matching them on name and UniProt accession, for each available species. However, please note that inconsistency in naming of targets may lead to data for the same target being reported across multiple charts. ✖ |
|
|||||||||||||||||||||||||||||||||||
| References |
|
1. Hawthorne R, Cromer BA, Ng HL, Parker MW, Lynch JW. (2006)
Molecular determinants of ginkgolide binding in the glycine receptor pore. J Neurochem, 98 (2): 395-407. [PMID:16805834] |
|
2. Thompson AJ, Duke RK, Lummis SC. (2011)
Binding sites for bilobalide, diltiazem, ginkgolide, and picrotoxinin at the 5-HT3 receptor. Mol Pharmacol, 80 (1): 183-90. [PMID:21505038] |
|
3. Thompson AJ, Jarvis GE, Duke RK, Johnston GA, Lummis SC. (2011)
Ginkgolide B and bilobalide block the pore of the 5-HT(3) receptor at a location that overlaps the picrotoxin binding site. Neuropharmacology, 60 (2-3): 488-95. [PMID:21059362] |


